This tutorial will go over how to create stacked and side-by-side bar charts in RStudio with ggplot.
To get started, make sure you have ggplot installed using
install.packages("tidyverse")
tidyverse contains multiple different packages including ggplot.
Next, we’ll import the data set and include tidverse like so:
library("tidyverse")

# The path of the file will depend on your machine, make sure it's changed
# accordingly
movies = read.csv("D:/Intro to Stats/Movies_06-15txt.csv")
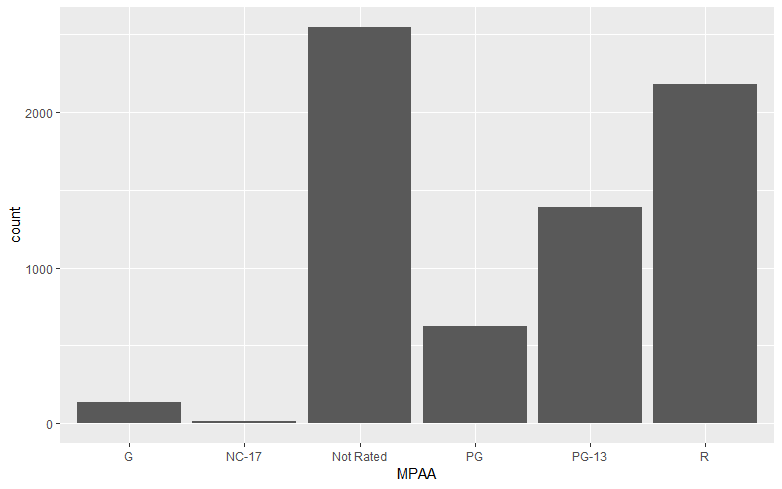
And make a basic bar graph:
ggplot(movies, aes(x = MPAA)) +
  geom_bar()
We can now display more variables my adding an additional argument to aes() in the ggplot() function. To display an additional variable, specify the fill argument making it equal to a name of a categorical variable in your data set.
ggplot(movies, aes(x = MPAA, fill = Genre)) +
  geom_bar()
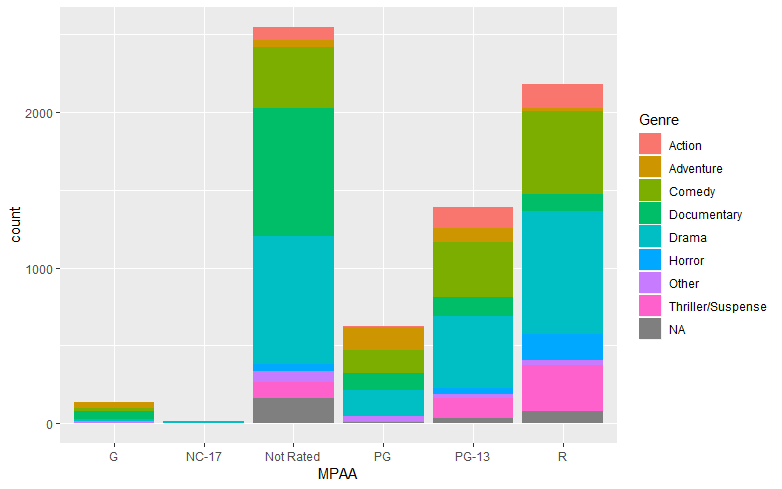
By default, ggplot will display it as a stacked bar graph. To get the bars to display side-by-side, we’ll add an argument to geom_bar():
ggplot(movies, aes(x = MPAA, fill = Genre)) +
  geom_bar(position = "dodge")
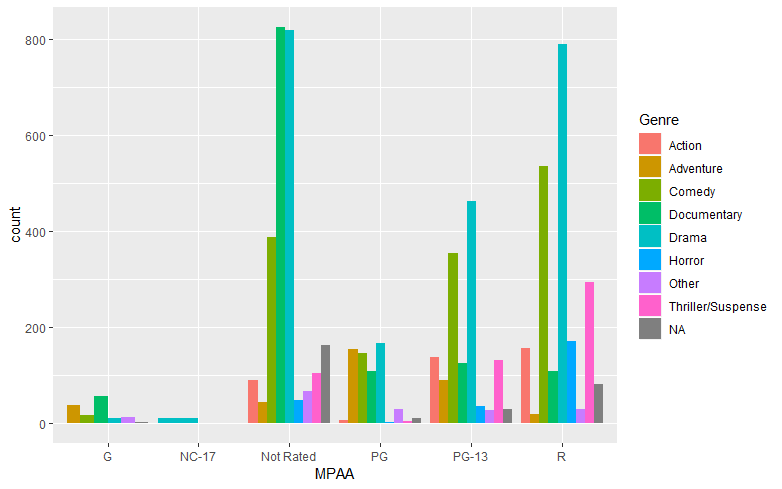
By specifying the position argument, we can change the position of the individual bars. For “dodge”, think of it as the bars are dodging each other to reach the x-axis of the graph.
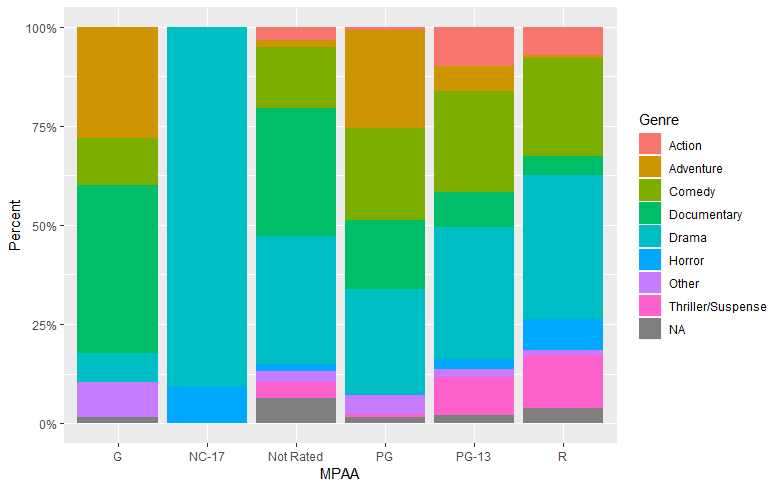
Looking at your previous graphs, you can see that the “NC-17” rating is hard to see, and it looks like there are more than just Drama movies in the side-by-side graph. To fix this, we can display the bars as percentages rather than just counts. We can change the position argument:
ggplot(movies, aes(x = MPAA, fill = Genre)) +
  geom_bar(position = "fill")
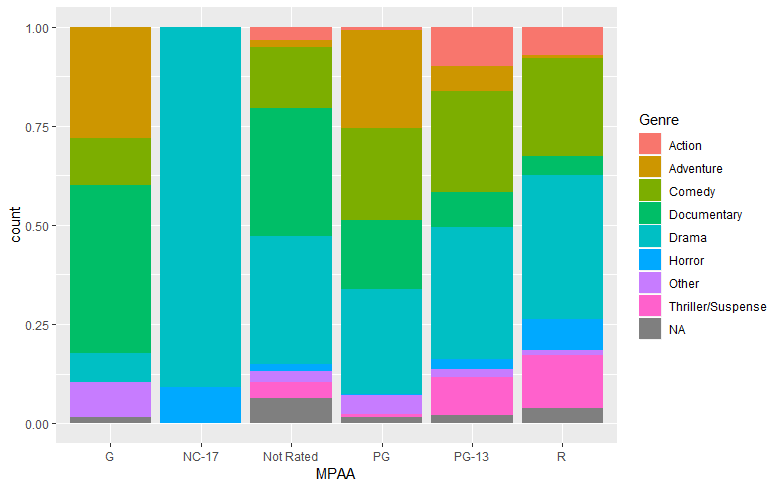
By changing position equal to “fill”, we can see that bars “fill” up their column. We can now see that NC-17 includes Horror films as well as Drama films. On the y-axis, you can see that the percentages are represented by decimals rather than percents. We can fix this by adding an additional function:
ggplot(movies, aes(x = MPAA, fill = Genre)) +
  geom_bar(position = "fill") +
  # Change the y scale to percent
  scale_y_continuous(labels = scales::percent) +
  # Change the y label
  ylab("Percent")